
by mariteaux
Happy New Year, everyone! Now that 2020’s over and I have a full year’s worth of data, I figured it’d be fun to look back at how we did as far as our Google rankings and traffic across our network goes. Of course, nothing here is especially mind-blowing as far as the numbers go, but fuck the numbers, it’s just curious to see what people are looking at. There’s lots of line graphs and pie charts too, if you like those. And…I might…
Google search performance
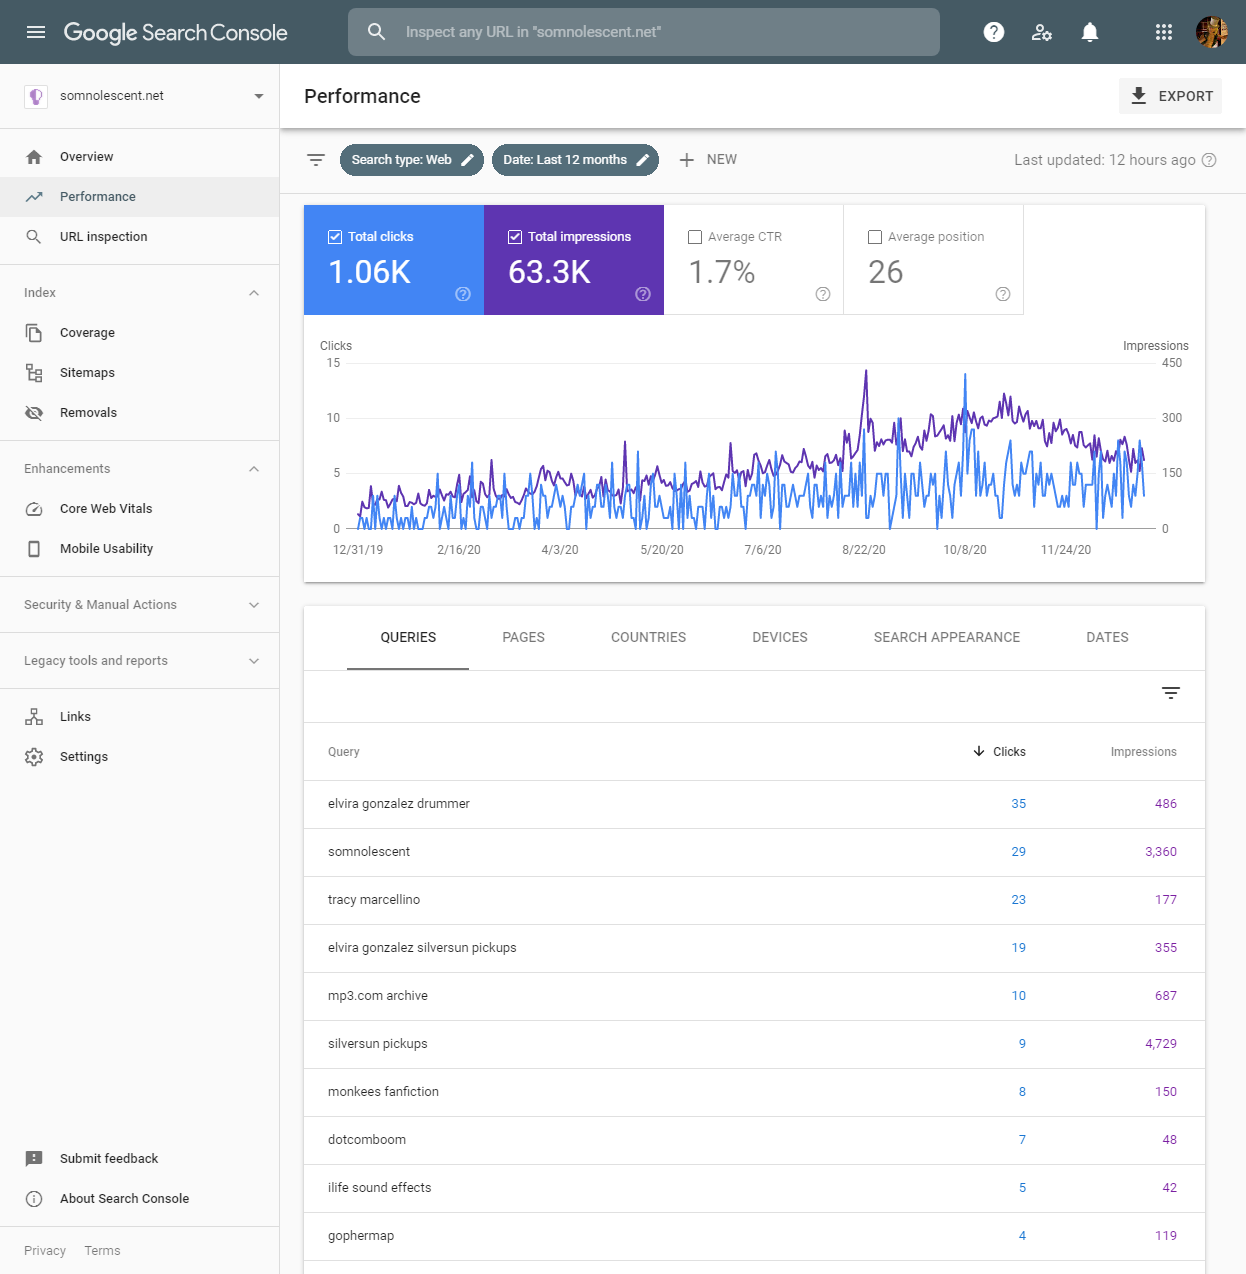
Our first stop brings us to the Google Search Console. After hooking your DNS settings up to a Google account, Google will give you some rather crazy in-depth information on not just your search rankings, but also your backlinks (links from other sites) and index coverage, in case you’re not seeing a page show up.
So, to start simply: what searches brought people to our network? Weirdly, Google has two tabs for it, “Queries” (which are the actual searches with estimated clicks, so ignore the numbers there) and “Pages” (which are the URLs with actual clicks, but you can’t see what search terms people punched in). They’re better taken together, that’s for sure.

First, let’s address the line graph. I can track four separate statistics over a period of time, total clicks, impressions (which means the amount of times our pages showed up in a search), CTR (click-through rate, or the percentage of impressions that resulted in a click), and the average position we occupy in the results.
Here’s the short of each of those four:
- Total clicks: We average about three or four clicks a day, generally, with the most recent day where no one clicked on our site through Google being December 8. Our best day of the year was October 8, with 14 clicks.
- Total impressions: Impressions peaked on August 23, with 430 impressions, and were at their mean highest in October through November. They’ve been trending downwards ever since.
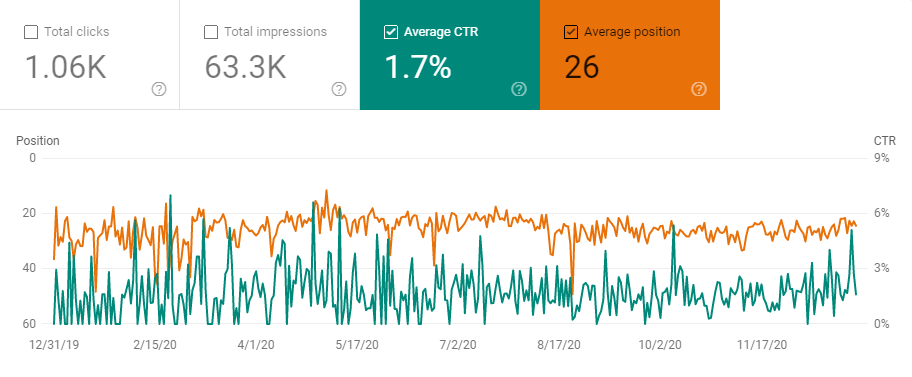
- Average CTR: CTR has had much fewer outliers in the second half of 2020, with an all-time high of 7% on February 22. Many of the days in that range, however, had a 0% average CTR, while we get fewer spikes now but a higher average CTR, in the 2-3% range.
- Average position: Much like CTR, fewer outliers, which means we don’t quite bomb as hard as we used to some days. We average between positions 22 and 26 most days (so third page, generally), with a peak of 11 (second page) on May 3 and an all-time low of 49 (fifth page!) on August 23. (This is the least useful statistic, as it mostly depends on people looking up our hottest query. For some searches, namely “Somnolescent”, we’re consistently on the first page.)
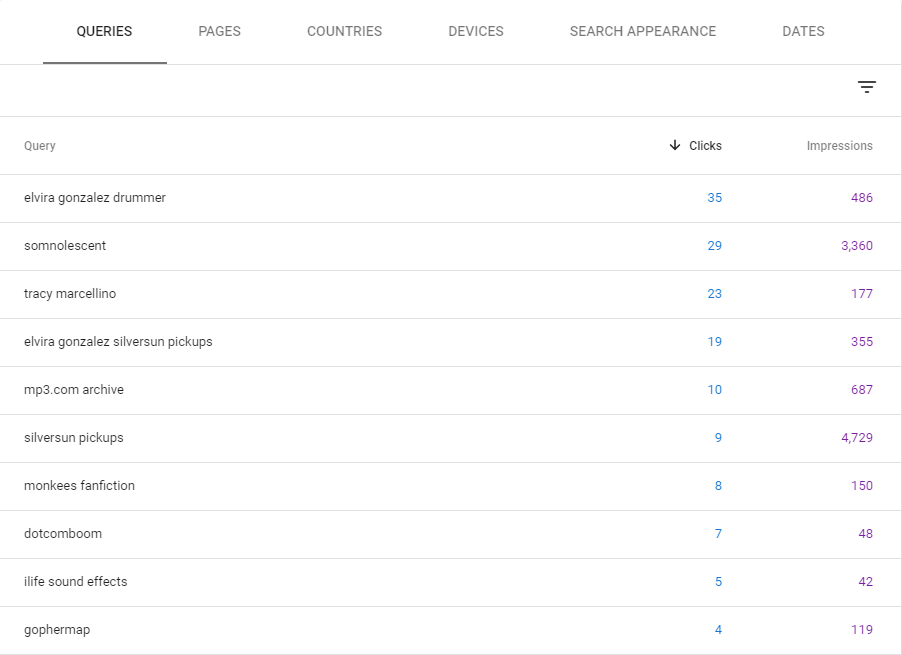
As far as the queries go, it was pretty much always Misery Inspires that ran away with it. I have some information on the two former Pickups members, Elvira Gonzalez and Jack Kennedy, and Tracy Marcellino is Brian Aubert’s wife. It’s only a paragraph each, so nothing creepy, but people are curious about ’em anyway, so they come here.
For other notable queries, we have people looking for any tracks from MP3.com (which I wrote about in my first MP3.com post–spoiler, very few survive), gophermaps (which brings people mostly to dcb’s gophermap editor), iLife sound effects, and something that endlessly amuses Caby and I, her Monkees fanfic archive actually ranks in our top ten searches.
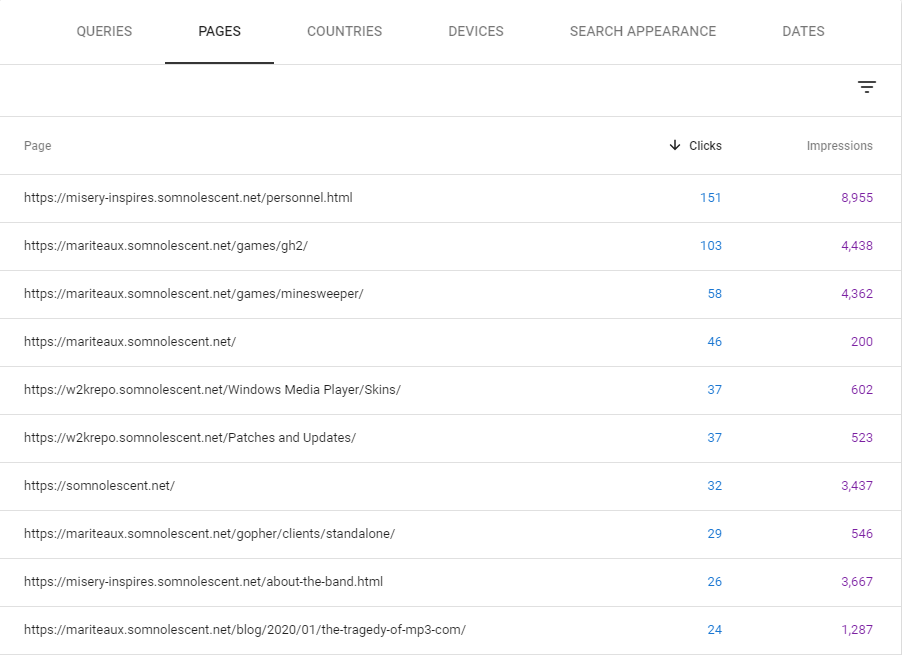
For pages, it’s a similar story, but now, my Gopher client reviews show up in the list, Clone Hero kids come looking for GH2 rips, the little bastards, my page on Minesweeper strategies that I wrote after 22 hours of being awake makes an appearance, w2krepo sees people looking for patches and Windows Media Player 7 stuff, and Somnolescent itself comes into the picture. I can click on any of these and see roughly what search terms brought people to those specific pages. Definitely a neat insight.
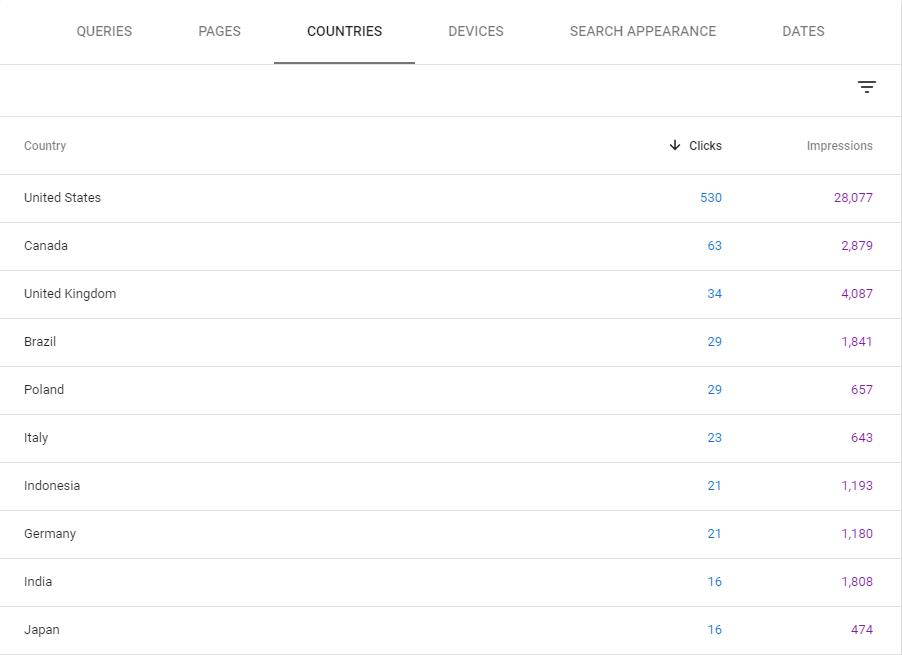
For some other data, have a look at the Countries tab. As expected, it’s tilted pretty heavily towards the English-speaking world and the US in particular. Brazil surprises me, and Poland less so (as I learned last night, both yoshi and Devon are Polish). Again, I can click on each of these and see just what pages are getting traffic in each country and what they’re punching in to see it. Japan likes my restored HeartGold/SoulSilver wallpapers, and Brazil’s peeking around for Clone Hero shit and finding my old rant about the Discord spyware doomers instead.
Finally, as far as Devices go, it breaks down into Desktop, Mobile, and Tablet searches that return a click onto our site. Desktop runs away with it, with Mobile only resulting in about 40% of its clicks. The vast, vast majority of Mobile clicks go to a single page on Misery Inspires, and that, my fellow Somnolians? Is proof that making your site mobile-friendly is pointless.
A lot of the other data isn’t exactly relevant to the wider internet, but one last bit I find surprisingly useful is the Links page. If Google, in its crawl, detects a linkback to our site, it’ll list it in my console, meaning I can see every single page on the visible internet that links to something on our network. Now, it’s not perfect–it’s usually our own links back to Somnolescent from other sites, and occasionally a ton of spam from archive.is clones gunks up the data–but it’s still fun seeing where we get mentioned from time to time.
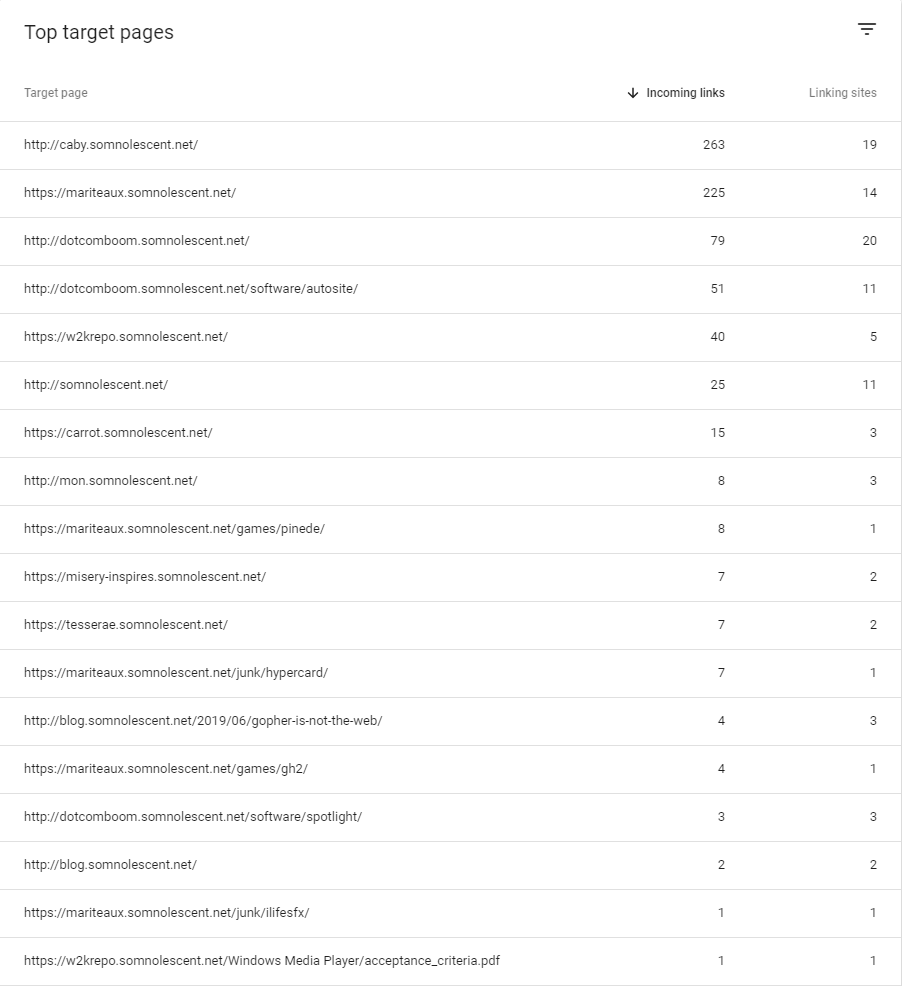
I’m not showing you specifics, but here’s the gist. Caby’s site is the one with the most linkbacks, mostly thanks to gwtagacw being a redirect for her Somnol site, and I’m not far behind. Everything else tends to trail off pretty quickly. Notably, even though Misery Inspires towers everything else as far as the search results go, Google’s only ever found seven links to it, mostly from pages on Devon’s site, and another two from a Gopher proxy that Google used to crawl our Gopherhole.
So remember kids, if you want the old web back, you gotta link to the sites you like and use. (I have plans to follow my own advice here, yes.)
DreamHost statistics
One lovely, less talked about feature of DreamHost are the statistics and logging you get for every single hit to your site, obviously regardless of where it comes from. This comes with a whole host of generated graphs for user agents, which files are being requested, percentages of HTTP statuses being sent (in case you have a lot of broken links or something), and so on.
Now, DreamHost’s statistics come with a bunch of caveats, but they’re still a fun read on occasion. In fact, let’s get into the caveats quick:
- No true yearly statistics, only “daily”, “monthly”, and “longterm” (which is from when you enabled statistics)
- You have to set up a “stats user” for each domain, and no, you cannot add the same one to all the domains (20 different passwords, potentially!)
- HTTP and HTTPS are counted separately, another reason I don’t enable HTTPS on new subdomains
- A lot of the data is too granular (say, individual IP addresses–which I invariably top the list on…)
- You have to enable statistics as said, which means I don’t have any data for
autosite,archives,caby, orw2krepo(enabled now at least, lads) - “Requests” doesn’t mean users, necessarily, as robots and web crawlers are also included in the logging (still majority humans, though, I’d say)
As a result, I’ll only be showing you the December 2020 traffic for the top-level site and Letters for the moment. Unless I say otherwise, this is only the data for the HTTPS requests (remind me to kill that for every other site too >_>). Still, there’s a lot to dig through. And crunchy graphs too!
somnolescent.net
So here’s some quick data to start us off:
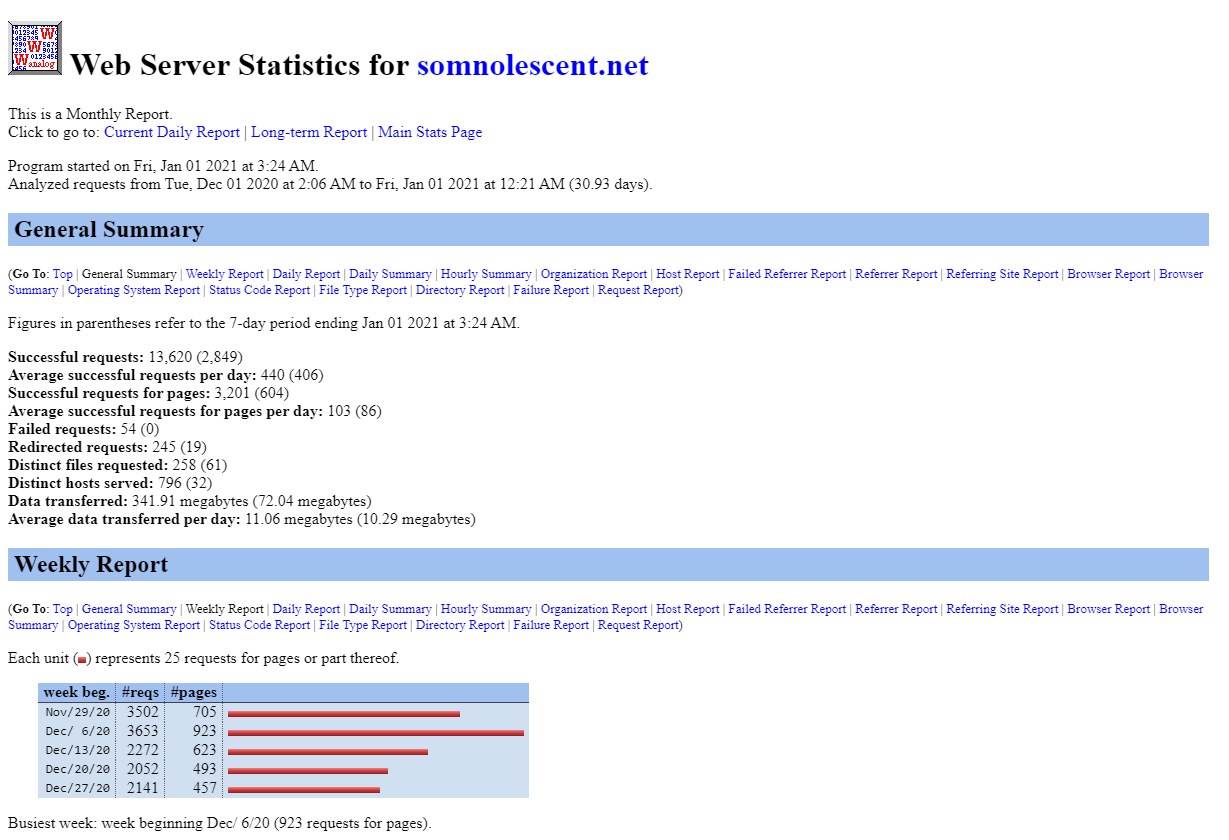
- Our best day in December was the first, followed by the 8th.
- People really like our site on Tuesday above all else.
- Most of our traffic comes in the early morning until noon.
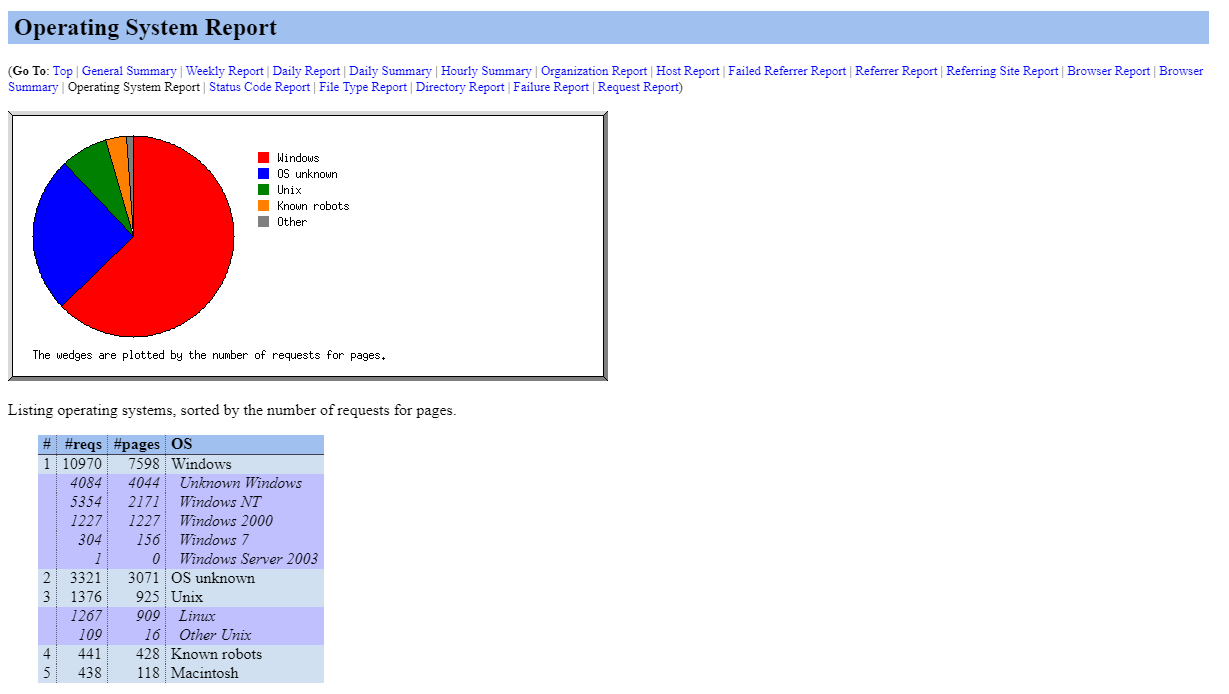
- Most of our audience uses Windows (like good, generate people should).

We had 754 requests for our main page. The manifesto was the second most popular page, at 111 requests, followed by our Somnolians page at 102. Now, browsers are an interesting topic. The HTTPS requests are all pretty standard, modern browser fare (boring!), but seeing what’s accessing the site over HTTP is pretty neat:
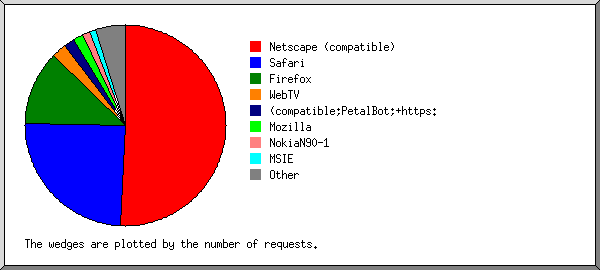
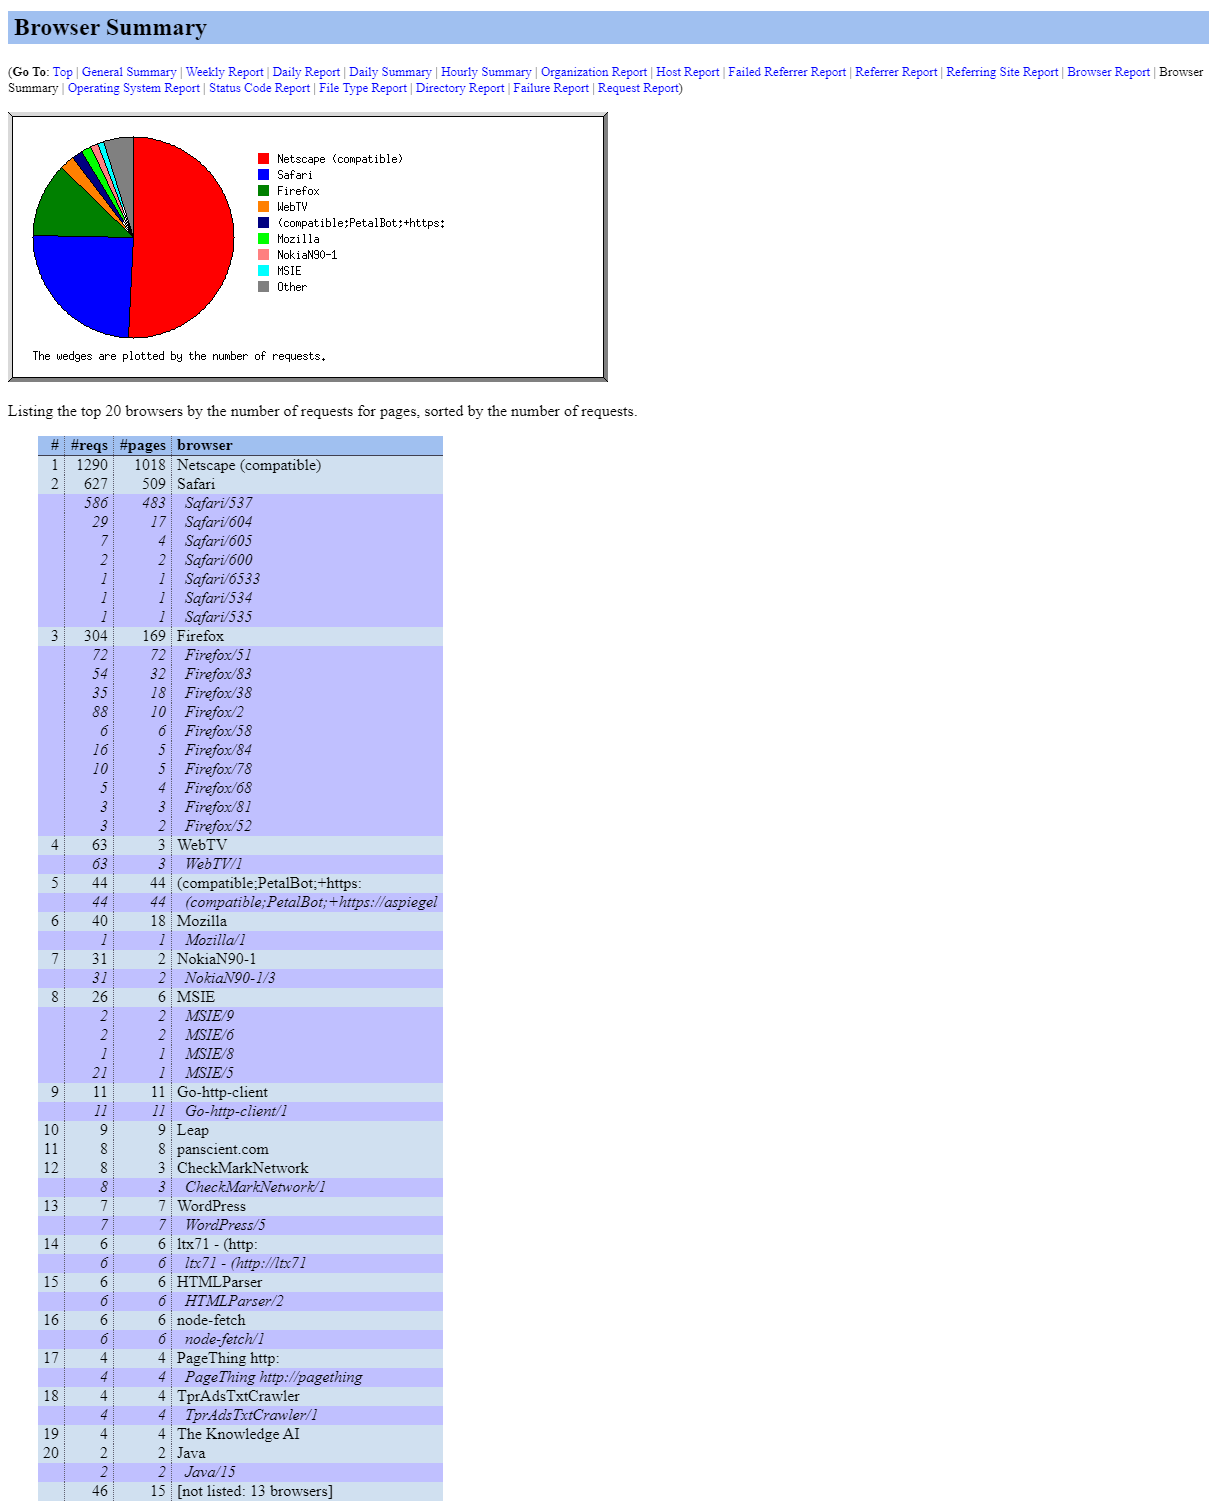
Finally, also from the HTTP world, the vast majority finding the site are actually coming from our Neopets user lookup! Perhaps that’s something to make even fancier in the new year.

blog.somnolescent.net
And the quick data for Letters:
- The blog’s best day was, naturally, Christmas, seeing as Caby had a post up and the yearly recap also went up on that day.
- The blog is more a favorite of people who really want the weekend to be here already, seeing as most of December’s requests came on Thursdays or Fridays.
- Most people come to read Letters in the late morning into the afternoon.
- A solid 60% of the blog’s traffic came from Windows faithful. Windows 2000 users love the blog.
A majority of requests (about 40%, and 90% of the total bytes shifted) came from RSS readers, which I highly appreciate. If you’re wondering what the most popular articles on the blog were in December, look no further than Caby’s Yerf post, and following it (with about half of the requests), the year recap.

Wrapping up the numbers post
This post was a pretty interesting one to put together, but honestly, you’d be surprised at how little I actually look at any of this. To me, it’s more of a fun novelty than anything else. Ever wonder why every YouTube thumbnail has faces and big, stupid text in it? It’s because “people respond well to faces”, according to the numbers. Numbers like these!
Our internet is built on traffic, engagement, and playing the numbers game or playing algorithms than building friendships. If you’re into the old web, that’s the thing you should aim for. Don’t aim for having a Discord server with hundreds of people, have a good, tight-knit server with a few people you love talking to. Email someone! Leave a comment on our blog! Even on old posts, we still get them and still most often respond to them.
Trust me, you’ll be way more fulfilled enjoying that sorta conversation than paying attention to your follower count on your Twitter no one reads. You might not even wanna go back! I certainly haven’t…
The numbers are still a neat thing to look back on though, and that’s why I put this post together. I guess I should get around to installing a real analytics plugin on the blog at some point. And getting rid of HTTPS across our entire network, because fuck, that’s more trouble than it’s worth at this point.
Tags: DreamHost, internet, Somnolescent, WordPress,